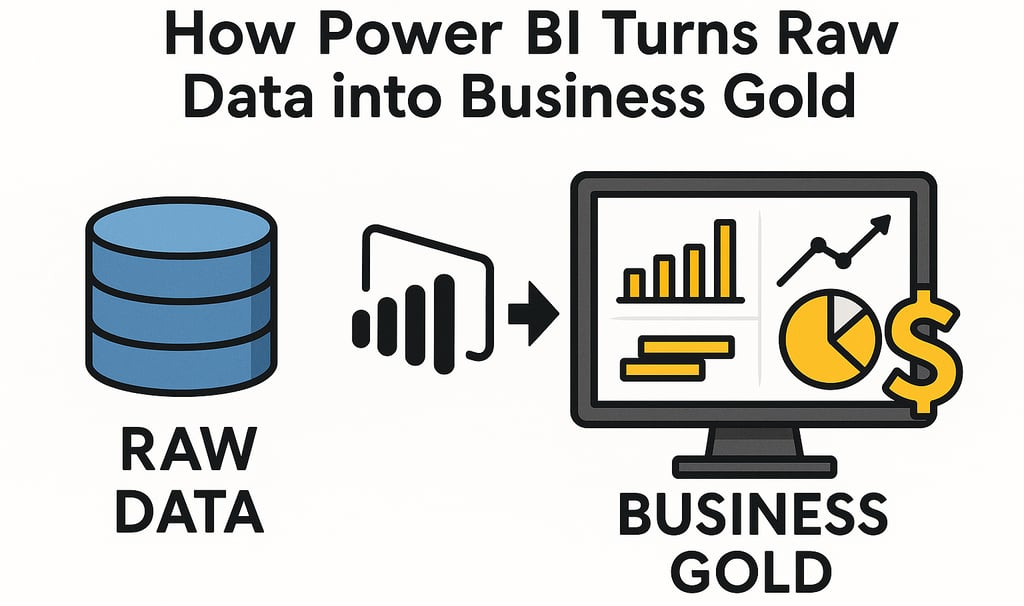
In every organisation, data is constantly generated—sales transactions, customer interactions, supply chain updates, financial activity, workforce metrics, and more. Yet most of this information sits untouched, scattered across systems, files, and spreadsheets. Raw data on its own is noise. The value appears only when it is organised, interpreted, and transformed into insight.
This is exactly where Power BI changes the game. It takes the overwhelming complexity of data and turns it into something structured, visual, and deeply useful. For businesses aiming to make smarter, faster decisions, Power BI is the bridge between confusion and clarity.
Bringing disconnected data together
Modern businesses rely on dozens of tools—CRMs, ERPs, cloud apps, Excel files, SQL databases. Power BI connects all of them in one place. Instead of jumping between systems or merging spreadsheets manually, decision-makers get a single, unified view of the organisation.
This means leaders no longer guess what’s happening. They see it.
Sales trends become visible
Operational delays surface
Customer behaviours stand out
Financial risks appear early
When data finally talks to each other, the bigger picture emerges.
Cleaning and shaping messy data into something trustworthy
Ask any analyst: the real struggle with data is never the dashboard—it’s getting clean, reliable data in the first place. Power BI transforms messy, inconsistent raw data into something usable through Power Query and automated data pipelines.
Duplicate records disappear.
Broken formats are fixed.
Scattered sources become structured models.
And once this foundation is set, the entire reporting process becomes faster, more accurate, and repeatable.
Dashboards that turn complexity into confidence
A powerful insight doesn’t need paragraphs of explanation—it needs a clear visual. Power BI dashboards do exactly that. They translate complex datasets into charts, cards, indicators, and visuals that anyone can understand instantly.
Executives glance at KPIs and know exactly what to act on.
Managers explore trends without waiting for manual reports.
Teams make data-driven decisions with clarity, not confusion.
Great dashboards don’t just show data—they tell a story.
Real-time insights that evolve with your business
Static reports belong to the past. With Power BI, data refreshes automatically. Whether the business is scaling, shifting strategy, or facing new challenges, dashboards adapt in real time.
You’re no longer reacting to last month’s numbers—you’re responding to today’s reality.
This agility turns Power BI into more than a reporting tool. It becomes a living, breathing decision-support system.
Turning raw data into a competitive advantage
Every organisation has data. Only the smart ones know how to unlock its value. With Power BI, raw information becomes a strategic asset: improving performance, reducing cost, identifying opportunities, and helping leaders navigate uncertainty with confidence.
When chaos becomes clarity, decisions become stronger—and businesses grow smarter.